


The S&P 500 has breached the psychological airlock of 6,950, trading within striking distance of the 7,000 threshold as of this morning’s session. The narrative driving this extension is no longer the “soft landing” of 2024 or the “anticipation” of 2025—it is the raw mechanical force of liquidity realized. Following the Federal Reserve’s 25-basis-point cut in December 2025, which brought the target range to 3.50%–3.75%, the cost of capital has officially reset to a neutral stance. The market is no longer fighting the Fed; it is now fighting the law of large numbers.
We are witnessing a pivotal structural shift. 2025 delivered an 18% total return for the S&P 500, driven largely by multiple expansion (PE ratios expanding to ~22x) rather than raw earnings velocity. The “Magnificent Seven” accounted for over 40% of those gains, but the monolithic unity of Big Tech is fracturing. As we enter late January 2026, a divergence has emerged: Alphabet (GOOGL) is up nearly 5% YTD on Gemini integration successes, while Microsoft (MSFT) and Apple (AAPL) have stumbled out of the gate, weighed down by capex ROI scrutiny.
The data reality for the current week is unambiguous: The “Melt-Up” is intact, but the fuel source is changing. We are transitioning from a liquidity-driven rally to an earnings-dependent survival phase.

The Liquidity Handoff: 2025 Realized vs. 2026 Reality
The defining characteristic of the 2025 bull run was the successful execution of the “Fed Pivot.” The central bank delivered three rate cuts in the second half of 2025, lowering the floor under risk assets. However, the forward guidance issued at the January 2026 FOMC preparatory meetings suggests a hard pause. Inflation, while cooled, remains sticky at 2.4% (PCE), preventing a return to the zero-interest-rate policy (ZIRP) era.
The bond market has already priced this in. The 10-year Treasury yield is oscillating, refusing to break significantly lower, which signals that the “easy money” trade is over. The alpha in 2026 will not come from falling rates, but from the idiosyncratic ability of corporations to defend margins in a 3.5% rate environment.
Critically, the “liquidity impulse” that lifted all boats in 2024 and early 2025 is fading. We are seeing a sharp bifurcation in sector performance. Financials and Industrials are bid up on nominal GDP strength (Q3 2025 GDP surprised at +4.3%), while Consumer Discretionary is lagging as household savings rates normalize. The market is effectively saying that the macro tailwind is gone; now show us the micro execution.

The Mag 7 Fracture: Concentration Risk Redefined
For the last 24 months, the “Magnificent Seven” acted as a singular asset class. That correlation has broken in January 2026. The dispersion of returns among these seven names is now at its widest point since 2022. This is a “show me the money” moment for AI capital expenditures.
In 2025, Nvidia (NVDA) rebounded from mid-year volatility to post a 39% gain, silencing critics who called for a cyclical peak. However, the narrative for 2026 has shifted from “chip demand” to “software revenue.” Microsoft and Meta are under immense pressure to prove that their $100B+ annual capex run rates are generating accretive cash flow, not just defensive moats. The market’s punishment for Microsoft’s flat start to 2026 (-2% YTD) stands in stark contrast to Alphabet’s +5% breakout.
Unlock deeper strategic alpha with a 10% discount on the annual plan.
Support the data-driven foresight required to navigate an era of radical uncertainty and join a community of institutional-grade analysts committed to the truth.
The greatest risk to the S&P 500 in 2026 is not a recession, but an AI capex “air pocket” where infrastructure spending slows before software revenue ramps. If hyperscalers signal a pause in GPU accumulation in their Q4 2025 earnings calls (occurring now), the 6,950 level will prove to be a local top.

Macro Outlook: The Inflation Floor
While the “soft landing” has been achieved—evidenced by real GDP growth of 2.3% in Q4 2024 and accelerating to 4.3% by Q3 2025—the cost of this victory is a higher resting heart rate for inflation. The Fed’s preferred metric, Core PCE, is sticky at 2.4%. This is the “last mile” problem manifesting as a permanent resident.
This implies that the neutral rate (r-star) is higher than the previous decade’s average. Investors betting on a return to 2% yields or 2% mortgages are fighting a structural reality. The 2026 vintage of the bull market requires comfortable coexistence with 3.5% yields and 2.5% inflation. Assets that require zero-cost capital to function will continue to liquidate, while cash-rich operators (the top 10% of the S&P 500) will consolidate power.
Strategic Implication: The Beta Trap
Passive indexing in 2026 carries higher risk than in 2025. With the S&P 500 trading at 22x forward earnings, the index is priced for perfection. Any deviation in earnings growth—forecasted at 12% for 2026—will result in rapid multiple compression. The “easy beta” has been harvested.
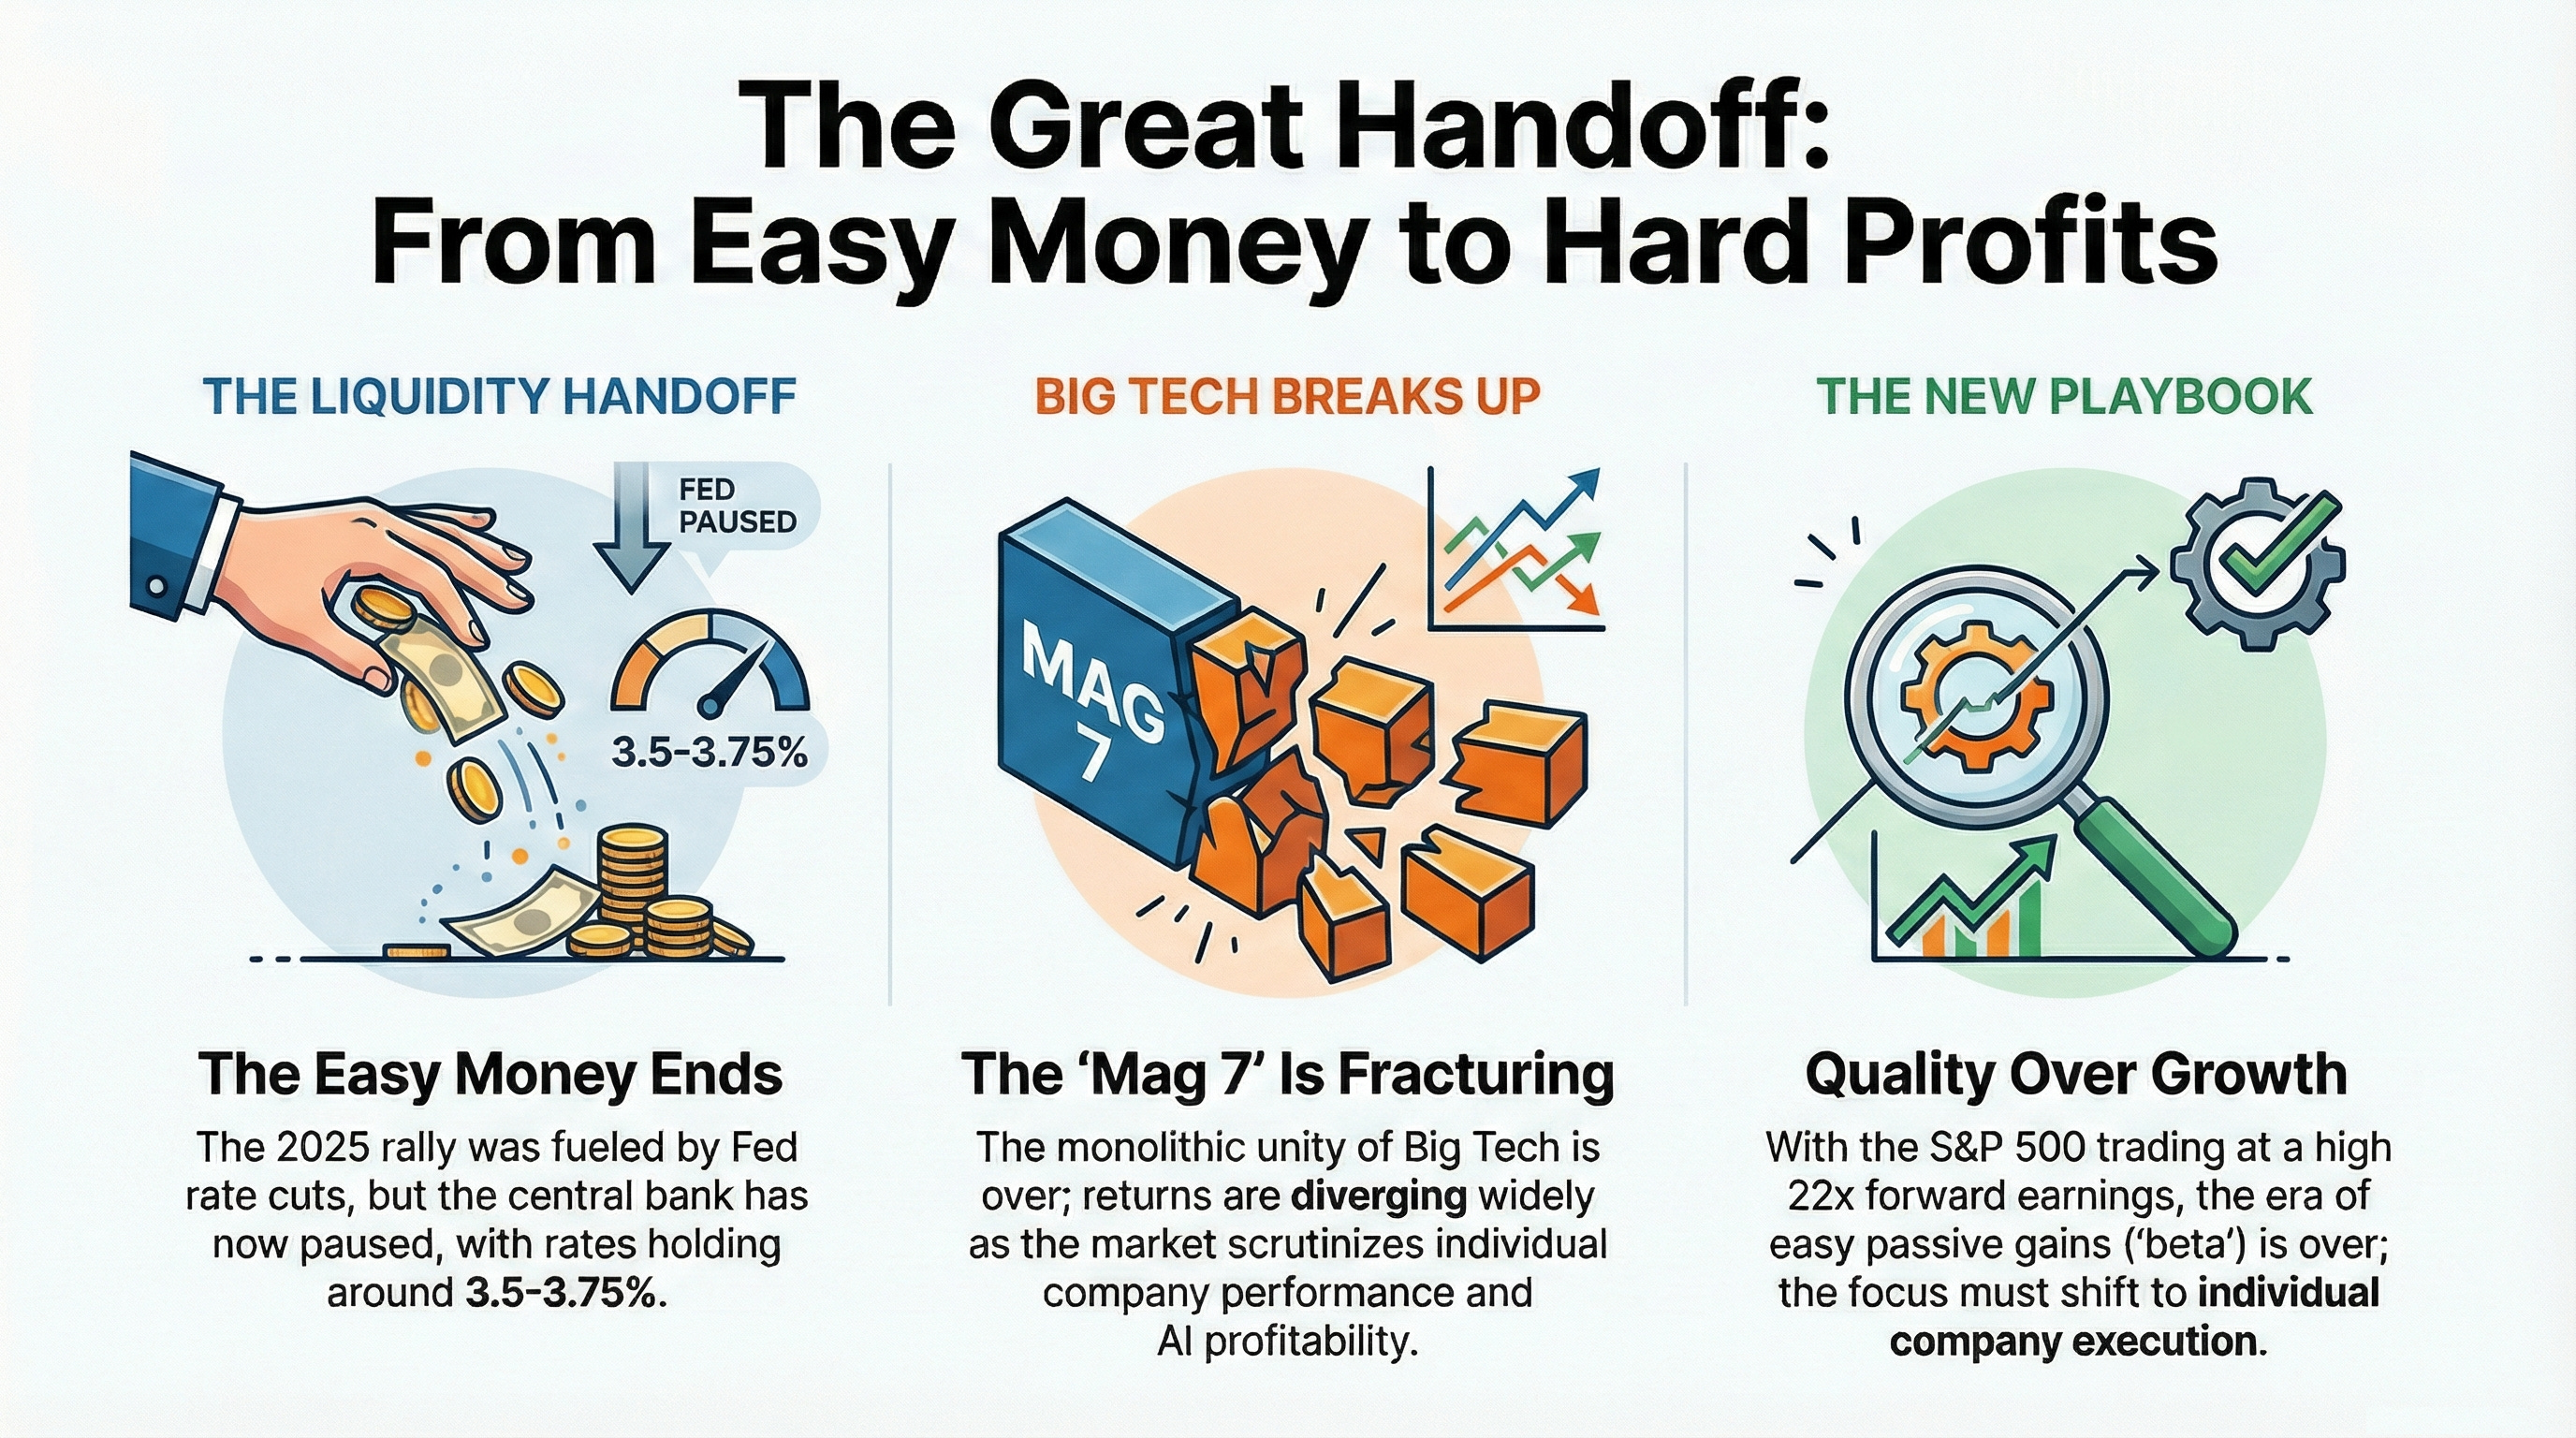
The play now is Quality over Growth and Execution over Expansion. Watch the diverging fortunes of the Mag 7 closely this earnings season; it is the canary in the coal mine for the broader index.