


A note before we start. This is the first issue of the new Intel Briefing: three briefings a week on fixed days. The Signal (free) sets up one shift in the world. The Dossier (members) goes deep and puts a probability on what happens next. The Weekly Assessment on Friday scores the week. Every forecast goes into a public Forecast Ledger. Read what changed →
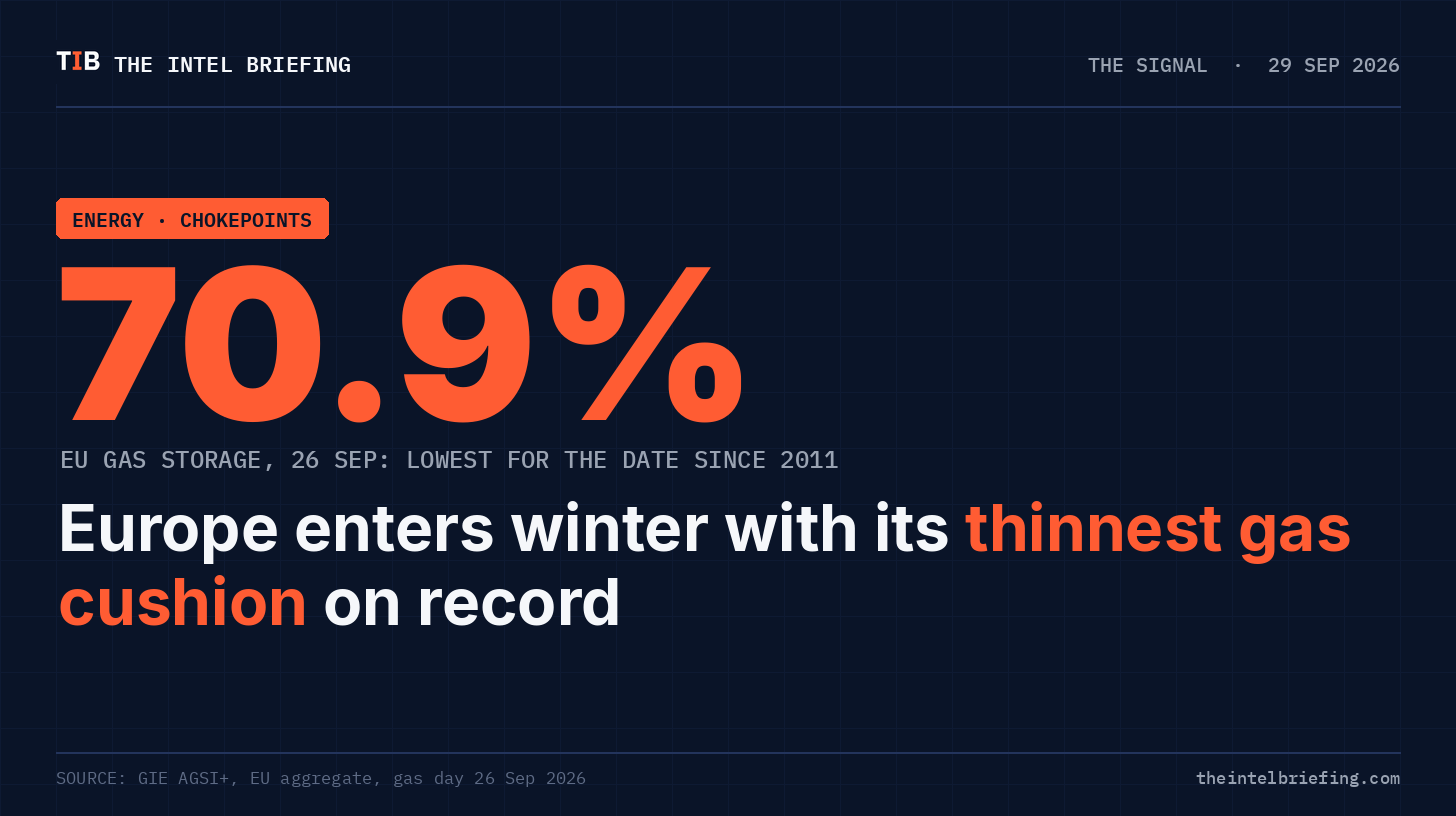
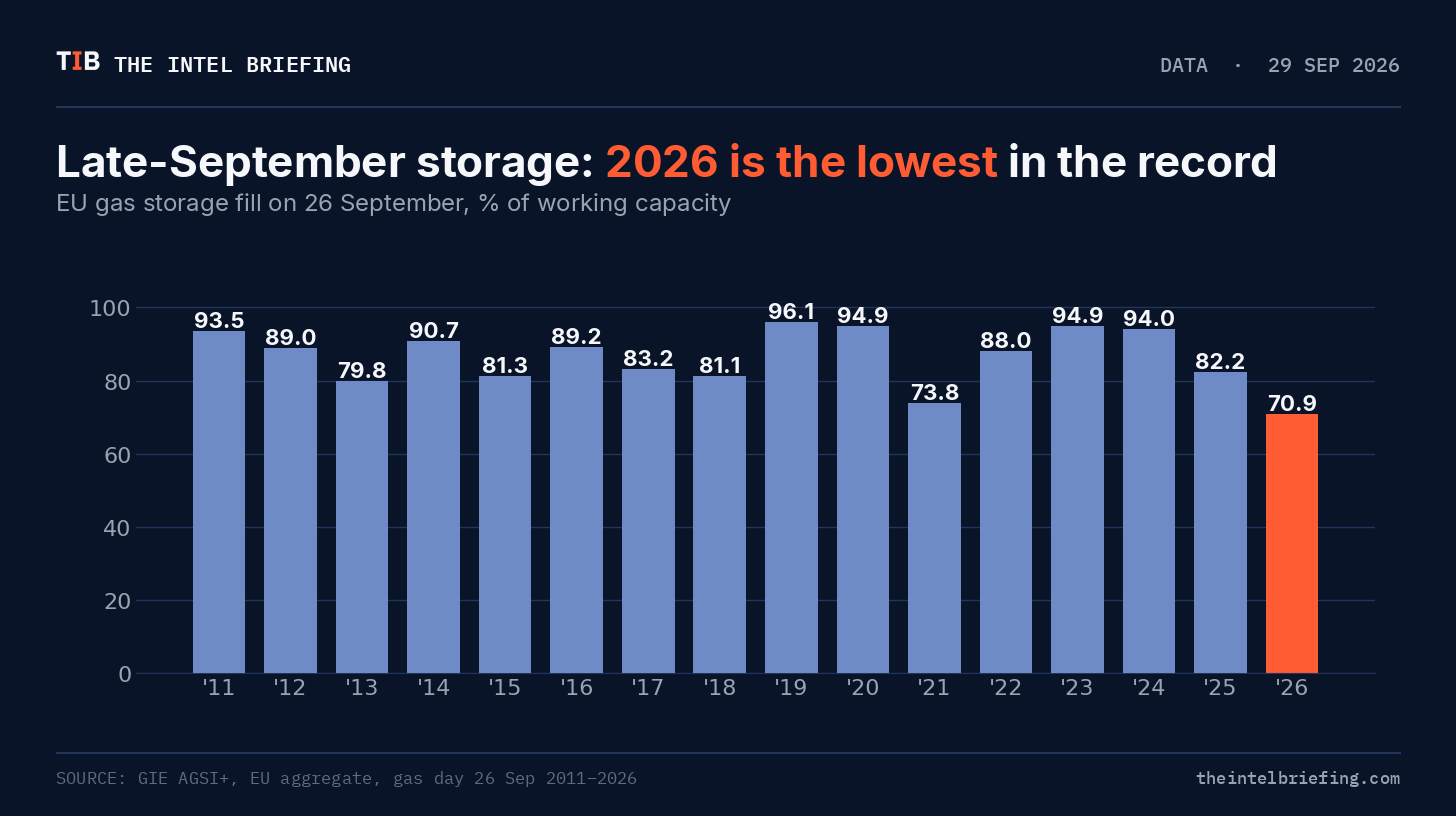
On 26 September, the European Union’s gas storage sites held 802 TWh, or 70.9% of capacity, according to Gas Infrastructure Europe’s AGSI+ transparency platform. That is the lowest fill for late September in AGSI data going back to 2011.
Europe has faced low storage before. What’s different this time is that the usual fix, buying more LNG on the spot market, is being outbid.
What changed
Three things happened in the past seven days.
Qatar extended its force majeure again. On 28 September, Italy’s Edison said QatarEnergy had extended force majeure on deliveries to the Adriatic LNG terminal until early December. Buyers in Pakistan, Bangladesh and India received similar notices, The National reported. The Strait of Hormuz carried about one-fifth of global LNG supply last year.
The fastest route to reopening closed. On 26 September, President Trump rejected Iran’s seven-day proposal to reopen the strait, telling reporters Iran wanted a deal “because they’re losing so badly”.
Europe’s refill is running out of calendar. Over the 30 days to 26 September, EU storage rose by an average of 0.22 percentage points a day (AGSI). At that pace, it reaches about 79% by 1 November (TIB estimate: 36 days × the 30-day average). In 2025 the fill was 82.8% on 1 November, and it was at or near 95% in 2020, 2022, 2023 and 2024.
The second-order effect: Europe is paying more and still getting less
The obvious story is “Qatar is offline, so Europe is short”. The more important one is where the replacement gas went.
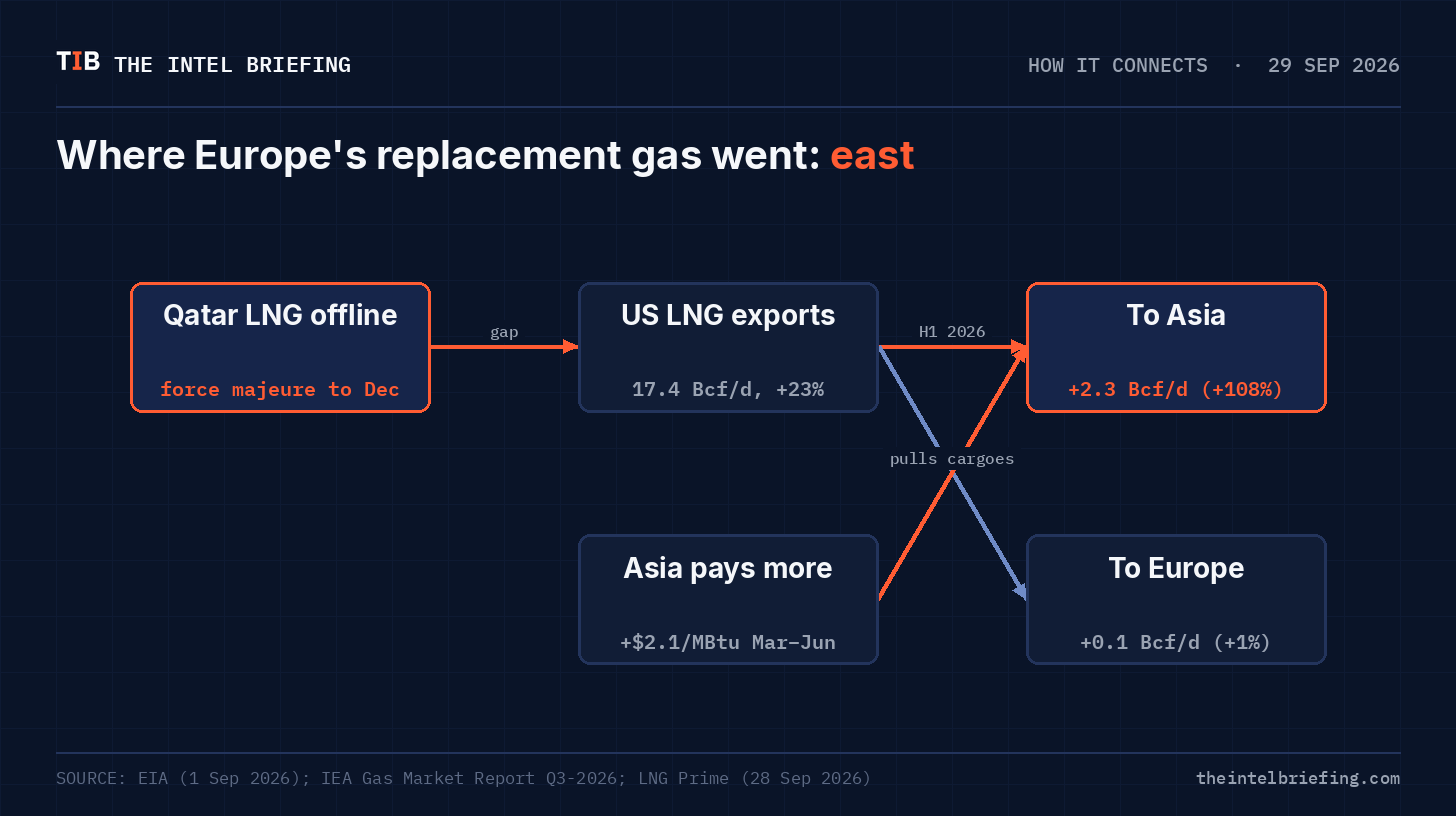
The United States has been the swing supplier. According to the U.S. Energy Information Administration, US LNG exports averaged 17.4 Bcf/d in the first half of 2026, up 23% year on year. But the growth went east:
Exports to Asia rose 2.3 Bcf/d, or 108%.
Exports to Europe rose 0.1 Bcf/d, or 1%.
The mechanism is price. The IEA’s Q3 Gas Market Report shows the regional premium flipped: Europe paid about $0.9/MBtu more than Asia in January–February, then Asia paid about $2.1/MBtu more than Europe from March to June. Flexible cargoes follow the higher price. Asia lost Qatari supply too, and outbid Europe for the replacement.
Assessment: Europe’s storage gap is not mainly a Qatar problem. It’s a bidding problem. To refill, Europe must pay enough to pull US cargoes back from Asia. That means the price of European gas this winter will be set by how much pain Asian importers can absorb before they stop buying.
That is already happening at the margin. Pakistan and Bangladesh, both on Qatar’s force majeure list, are among the buyers least able to compete on price.
.jpg)
Who pays, who gains
The EU average hides a split. On 26 September (AGSI), Germany was 57.4% full against 76.5% a year earlier, Belgium 61.3% against 93.8%, and Slovakia 53.8% against 75.5%. Italy (86.6%), France (82.5%) and Poland (98.9%) are far better stocked.
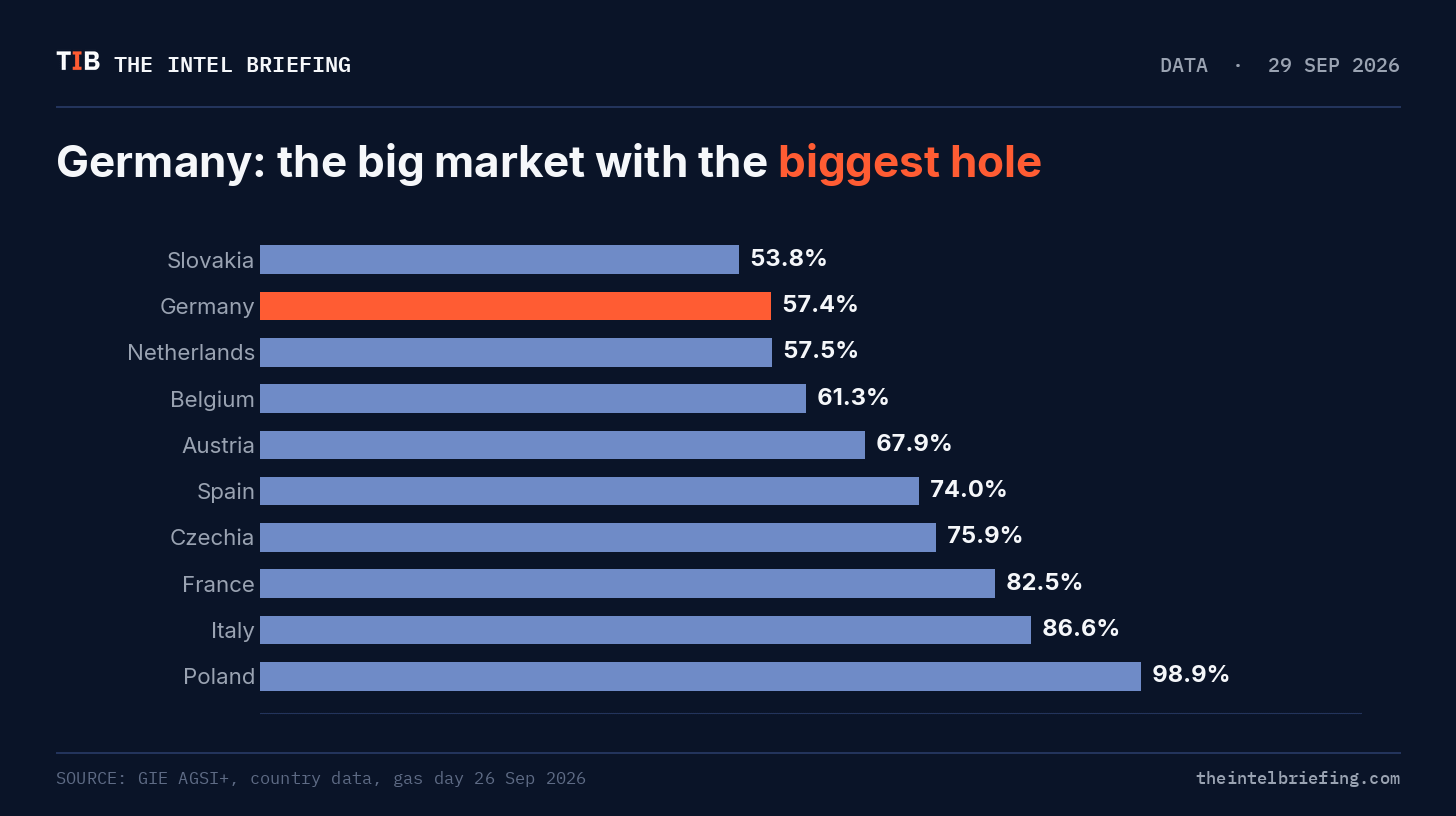
Who pays: Germany is the one that matters. It has the largest storage capacity in the EU (about 247 TWh of working gas, per AGSI), and it’s the least full of the big markets. Belgium, Slovakia and Austria have the steepest year-on-year drops. If a cold spell hits, the gap will show first in Central Europe.
Who is protected: Italy and France, whose stricter national storage policies (state-guaranteed margins and public-service filling obligations) kept stocks up, as Columbia’s Center on Global Energy Policy noted in April. Poland is essentially full.
Who gains: US LNG exporters, who are selling into two bidding markets at once, and Norway, whose pipeline gas has no strait to cross.
The EU’s own rules give governments room. The storage regulation, extended in July 2025, keeps a 90% target but allows it to be met any time between 1 October and 1 December. It permits a 10-point shortfall in difficult conditions, and up to 15 points if the Commission uses a delegated act. The legal floor is flexible. The physical one isn’t.
What to watch
EU storage on 1 November (AGSI). Now 70.9%. Below 77.1% would be the lowest 1 November fill in the AGSI record (the current low is 2021).
German storage (AGSI). Now 57.4%. Below 65% on 1 November means the largest market starts winter with roughly a third of its capacity empty.
TTF front-month. Now about €73/MWh (Trading Economics, 28 September), up about 124% on a year ago. Above €100 means Europe is paying to pull cargoes from Asia at scale.
On Wednesday
The storage number tells you where Europe starts. It doesn’t tell you where it ends. In Wednesday’s Dossier, we model four winters for Europe’s gas, from a mild season with Hormuz reopening to a cold one with it shut. We put a probability on each and name the six indicators that will tell you which one is arriving.
Members get the full scenarios, our Key Judgments with probabilities, and the Forecast Ledger where every call is scored.
Sources: GIE AGSI+ (EU and country data, gas days 26 Sep 2011–2026; 28 Aug–26 Sep 2026; 1 Nov 2020–2025) · U.S. EIA, 1 Sep 2026 · IEA Gas Market Report Q3-2026 · Council of the EU, 18 Jul 2025 · LNG Prime, 28 Sep 2026 · The National, 28 Sep 2026 · Jerusalem Post, 26 Sep 2026 · Trading Economics TTF, 28 Sep 2026 · Columbia CGEP, 23 Apr 2026 · TIB estimate: 1 Nov projection = 26 Sep fill + 36 days × the 30-day average daily change (0.224 pts/day).